Plate 1 figs. a–h · 4 observations
This species has been photographed under an open licence only 4 times, so some figures below are different views of the same plant, taken on the same day, rather than different individuals. They are usually different parts of it: the leaf, the flower, the bark.


Every figure is a research-grade observation under CC0, CC BY or CC BY-SA, rehosted with the photographer’s name, the licence and the observation it came from. Photographs under a NonCommercial licence are excluded from this site and are never stored, which costs us a great many pictures and is not negotiable.
Native range 3 botanical countries
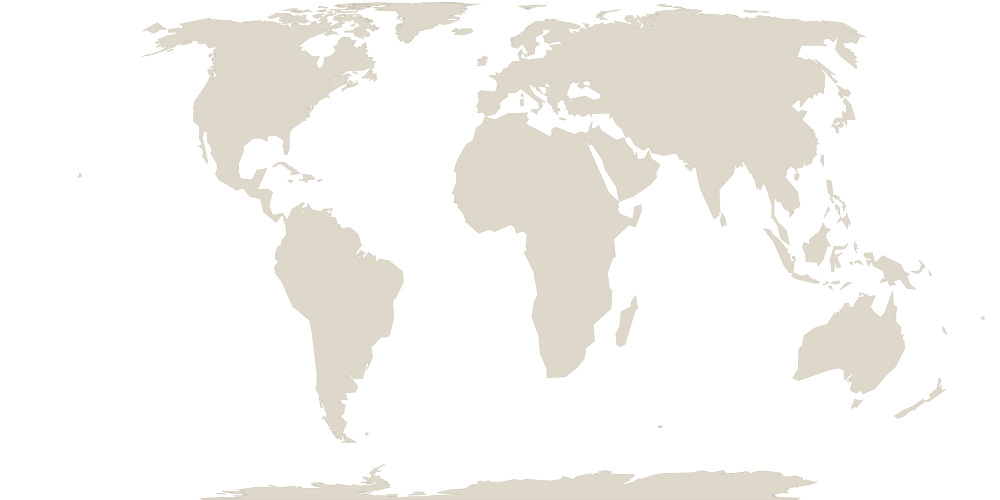
| Region | TDWG code | Continent |
|---|---|---|
| Georgia | GEO | NORTHERN AMERICA |
| North Carolina | NCA | |
| South Carolina | SCA |
Region boundaries approximated from Natural Earth (public domain) and mapped to TDWG World Geographical Scheme for Recording Plant Distributions (WGSRPD) level-3 botanical countries (Brummitt 2001). Indicative, not the official WGSRPD geometry.
Where it actually grows measured, from 46 observations
| Condition | 5th percentile | Median | 95th percentile |
|---|---|---|---|
| Coldest month, mean daily low | -6.6 °C | -3.4 °C | -0.4 °C |
| Warmest month, mean daily high | 20.7 °C | 24.2 °C | 28.2 °C |
| Annual rainfall | 1,596 mm | 1,957 mm | 2,071 mm |
| Rainfall in the driest quarter | 357 mm | 438 mm | 471 mm |
It is found where winters bring hard frost. This is not care advice and it is not a forecast. It is a measurement: we sampled the climate at every one of the 46 research-grade observations of Hypericum buckleyi that carry a coordinate, and this is the range those places actually span. The 5th and 95th percentiles are used rather than the minimum and maximum, because a single cultivated specimen in a heated conservatory should not widen a tropical plant's range to the Arctic.
This is not a hardiness zone. A USDA zone is the average annual extreme minimum temperature. The figure above is the mean daily minimum of the coldest month, which is a different quantity and is typically far warmer. Reading one as the other would place a plant several zones too warm, so we do not publish a hardiness zone, because we do not have one.
Sourcesevery claim on this page
- World Flora Online Plant List. accepted name, authority, classification. CC0. Retrieved 2026-07-12.
- iNaturalist. photographs and flowering annotations, CC0 / CC BY / CC BY-SA only. per photograph. Retrieved 2026-06-27.
- Kew, World Checklist of Vascular Plants (WCVP v16). native distribution by TDWG level-3 botanical country, and life form. CC BY 3.0. Retrieved 2026-06-04.
We publish what we can source and we say so when we cannot. This page has no care advice and no toxicity claim, because we do not yet have those from a source we can cite.