Plate 1 figs. a–h · 8 separate observations


Every figure is a research-grade observation under CC0, CC BY or CC BY-SA, rehosted with the photographer’s name, the licence and the observation it came from. Photographs under a NonCommercial licence are excluded from this site and are never stored, which costs us a great many pictures and is not negotiable.
The specimen a real sheet, in a real collection
- Herbarium
- The New York Botanical Garden
- Accession
- 04192392
- Filed as
- Baccharis latifolia (Ruiz & Pav.) Pers.
- Det. by
- J. Müller 2022-01-01
- Collected
- M. H. Nee 2009-11-01
- Origin
- BO
- The sheet
- View the digitised specimen (CC BY 4.0)
A real pressed plant, in a real collection, under the accession number above. Not an illustration of one. The holding institution does not serve this sheet’s image to third parties, so there is no photograph here. The record is real and the link goes to it. Where we hold no openly licensed sheet for a species this section is simply absent, and where a sheet never recorded who determined it, that field stays empty rather than being filled in. Roughly half of all herbarium sheets never recorded a determiner, which is ordinary.
Native range 6 botanical countries
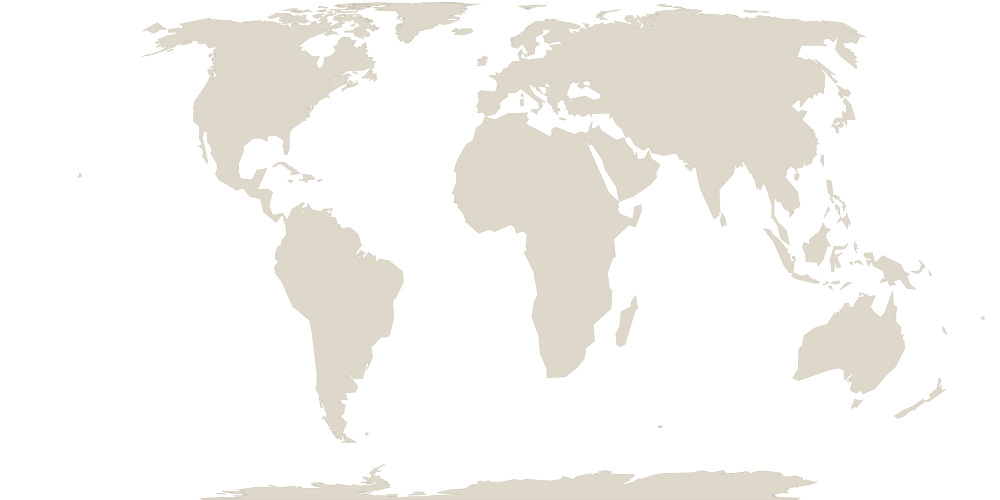
| Region | TDWG code | Continent |
|---|---|---|
| Argentina Northwest | AGW | SOUTHERN AMERICA |
| Bolivia | BOL | |
| Colombia | CLM | |
| Ecuador | ECU | |
| Peru | PER | |
| Venezuela | VEN |
Region boundaries approximated from Natural Earth (public domain) and mapped to TDWG World Geographical Scheme for Recording Plant Distributions (WGSRPD) level-3 botanical countries (Brummitt 2001). Indicative, not the official WGSRPD geometry.
Flowering 52 in flower of 63 examined
Peak flowering in Feb. Each bar is the share of Baccharis latifolia observations in which someone actually recorded the reproductive state and found the plant in flower, not the raw number of flowering records. That distinction matters: people observe plants far more in spring than in winter, so a bare count of flowering records partly measures when people go outside. Dividing by the number examined removes that. 52 of 63 examined observations were in flower, every one of them research grade. The whisker on each bar is a 95% Wilson interval. 6 months have fewer than 5 examined observations, so no proportion is drawn for them. This is still a global aggregate and not a forecast for your garden: the same species flowers on different dates in different hemispheres. Where a species has fewer than 30 flowering records we do not draw this chart at all. Computed from 10.15468/dl.cgje2x.
Where it actually grows measured, from 1,980 observations
| Condition | 5th percentile | Median | 95th percentile |
|---|---|---|---|
| Coldest month, mean daily low | -1.1 °C | 8.7 °C | 11.2 °C |
| Warmest month, mean daily high | 12.7 °C | 17.9 °C | 20.8 °C |
| Annual rainfall | 890 mm | 1,345 mm | 2,623 mm |
| Rainfall in the driest quarter | 48 mm | 147 mm | 321 mm |
It is found where winters bring light frost. This is not care advice and it is not a forecast. It is a measurement: we sampled the climate at every one of the 1,980 research-grade observations of Baccharis latifolia that carry a coordinate, and this is the range those places actually span. The 5th and 95th percentiles are used rather than the minimum and maximum, because a single cultivated specimen in a heated conservatory should not widen a tropical plant's range to the Arctic.
This is not a hardiness zone. A USDA zone is the average annual extreme minimum temperature. The figure above is the mean daily minimum of the coldest month, which is a different quantity and is typically far warmer. Reading one as the other would place a plant several zones too warm, so we do not publish a hardiness zone, because we do not have one. Climate from CHELSA V2.1 (Karger et al. 2017); occurrences from 10.15468/dl.cgje2x.
Also published as 12 synonyms
A synonym is not an error. It is a record of botanists disagreeing, in print, about where this plant belongs. Each of these was somebody’s considered answer.
- Baccharis floribunda Kunth
- Baccharis polyantha Kunth
- Baccharis polyantha f. polyantha
- Baccharis polyantha var. macrophylla Hieron.
- Baccharis polyantha var. polyantha
- Baccharis riparia Kunth
- Molina latifolia Ruiz & Pav.
- Pingraea latifolia (Ruiz & Pav.) F.H.Hellw.
- Pingraea latifolia Ruiz & Pav.
- Pingraea latifolia (Ruiz & Pav.) F.H.Hellwig
- Pluchea glabra Griseb.
- Vernonia otavalensis Gilli
Sourcesevery claim on this page
- World Flora Online Plant List. accepted name, authority, classification. CC0. Retrieved 2026-07-12.
- iNaturalist. photographs and flowering annotations, CC0 / CC BY / CC BY-SA only. per photograph. Retrieved 2026-06-27.
- Kew, World Checklist of Vascular Plants (WCVP v16). native distribution by TDWG level-3 botanical country, and life form. CC BY 3.0. Retrieved 2026-06-04.
We publish what we can source and we say so when we cannot. This page has no care advice and no toxicity claim, because we do not yet have those from a source we can cite.